Skip to the content of this page.
Note: This site will look much better in a browser that supports web standards, but is accessible to any browser or internet device.
NUCHI Home > Meetings > September
2002 > Web-based Card Sorting
Web-based Card Sorting for Information Architecture
Larry E, Wood (WoodL@byu.edu)
Jed R. Wood (jedwood@mac.com)
John Anderson (jayay@mail.sisna.com)
Brigham Young University
Abstract
We have devloped a web-based interface which allows designers to do electronic "card sort" studies. With it, designers can provide descriptions of features for which they'd like users to provide labels and to "sort" into categories. The results can be used to organize information and services access for “interface” design.
Introduction
As designers and developers, we all deal with the necessity to organize and label information. Although it is impossible to design a site so that one-hundred percent of the users will find exactly what they want one-hundred percent of the time, it is vital that our designs are based on organizational and labeling schemes which are meaningful and logical to users.
One helpful tool in gathering user input is card-sorting (Nielsen 1993), in which descriptions of items ( i.e. merchandise, individual web pages, etc) are written on 3 x 5 cards. Potential users are asked to read each of these descriptions, and write a label on the back of the card that best fits the description. The participant then places the cards into groups according to similarities between the items and provides a meaningful label for each of the groups. For example, in designing a web site for student services at a university, a participant might find the following three descriptions, among many others: “applying to the university on the internet”, “courses and programs for beginning students”, and “review and evaluation of credits for students transferring from other institutions.” On the backs of the cards, the student might write, “on-line application,” “freshman programs,” and “Transfer Student Evaluation,” respectively. Then the student might place these three cards into a group and call it “Admission Information.”
Though very helpful in organizing the content of the application or web site, card-sorting is a long and laborious process to administer. In addition, as the number of items increases, finding trends in how the users sort and label the descriptions becomes very difficult.
Electronic Card Sorting
Recently, a group at IBM developed a computerized system of electronic “card sorting” called EZSort© (Dong, Martin, & Waldo, 1999). It consists of two software programs that support the task of card-sorting. The first, U-Sort©, provides an interface for users to categorize descriptions of items and services. The results of individual participants are saved into files that are loaded onto the second program, EZ-Calc©, which uses cluster analysis to produce tree diagrams that reflect in the organization of the combined information from all users. These programs significantly reduce the time required to collect card sort data from a group of users, and also allows remote data collection. However, as useful as the EZSor©t system is, there are some drawbacks in the administration of U-Sort©, in particular. These include: (1) USort© and a a file of item descriptions must be downloaded by users and installed on their computers before being used, (2) The results file must then be sent back to the designer, and (3) USort© runs only on the Windows platform.
Web Sort
In order to overcome the major limitations of Usort, the authors have developed a web-based version called, WebSort which eliminates both the need for a user to download and install the Usort program send the results file to the developer. In addition, WebSort also adds functionality by allowing users to label the item descriptions. These labels guide the designer in deciding on appropriate headings, titles, and links for information.
General functions such as developing a list of items for labeling and categorization by participants, reviewing labels that have been provided by participants, and the production of files that can be used in the EZCalc application to perform cluster analysis files are available to a designer through an interface, called the "Manager", a screen shot of which is shown in Figure 1.
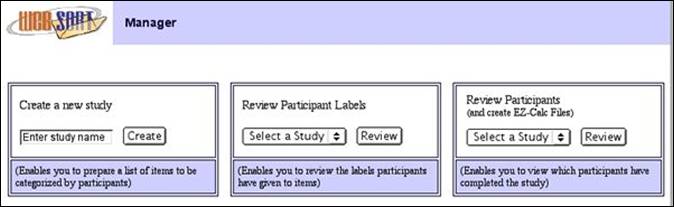
Figure 1. The Manager Interface.
The "Create" option in the left panel allows a designer to enter a name for a study, and the list of item descriptions to be labeled and categorized by participants. Pushing the “Create” button opens a window (shown in Figure 2 below) that supports this step in the process.
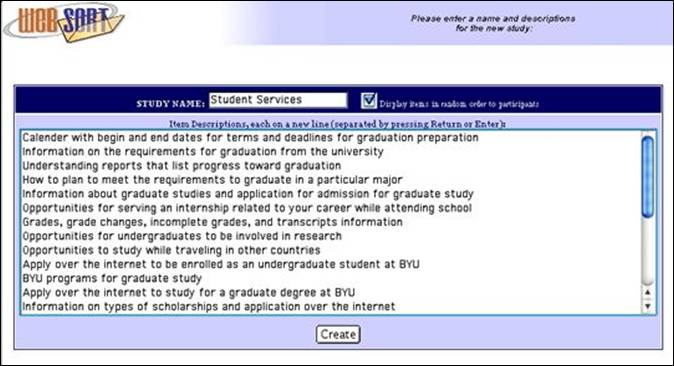
Figure 2. Screen to enter study name and item descriptions.
Users are then referred to the web site (presumably via email), with instructions where they enter their name and a study name, which then brings up an interface (shown below in Figure 3) that allows them to put meaningful labels on the item descriptions, and have them stored in a database for later analysis by the designer.
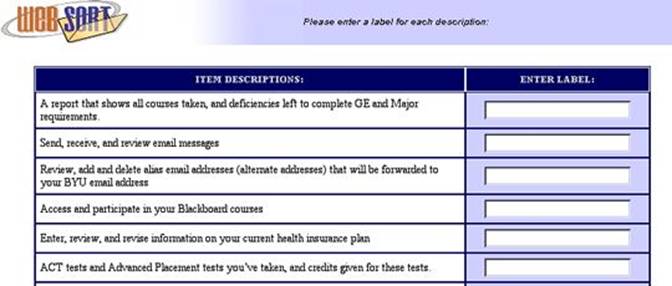
Figure 3. Screen on which participants enter labels for the item descriptions.
After the participants submit their lables for the item descriptions, they are asked to "drag and "drop" them into categories, using the inteface shown in Figure 4 below.

Figure 4. Screen for “sorting” items into categories.
As shown in Figure 4, categories are represented by folders. Folders are created by clicking on the “New Folder” icon. Item descriptions are dragged to and dropped onto folders, and they appear just below the relevant folder. This allows them to remain visible so that participants can easily view them and move them to other categories, if they desire.
The labels given to the item descriptions can be reviewed by the designer by choosing the appropriate study name from the pull-down list in the center panel of Manger interface ( Figure 1), and pressing the "Review" button. That opens a window (shown in Figure 5) that shows each description and the labels given it by the study participants.
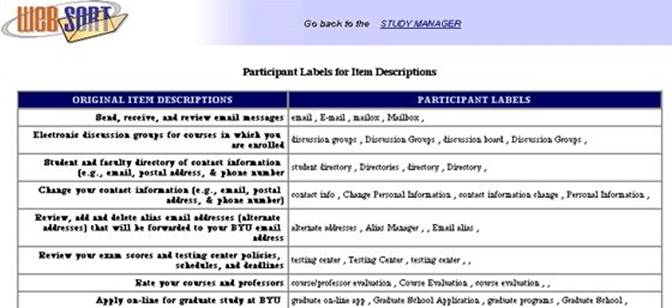
Figure 5. Labels given item descriptions by study participants.
The labels results are analyzed by reviewing them for consistent patterns, which will vary with each description and the number of participants. In the example above, with just four participants, there is an obvious pattern with the second and sixth items, whereas there isn’t as much on the fifth item description. Obviously, we would want to involve more participants in order to determine if were possible to find a more consistent pattern of results.
To analyze the “sorting” results, the designer must first select a study for review in the right panel of the manager interface in Figure 1. A selection presents a list of participants from which any or all can be selected, and then files are generated that can be used in the EZCalc© program and e-mailed to the reseasrcher. The selection screen is shown in Figure 6.
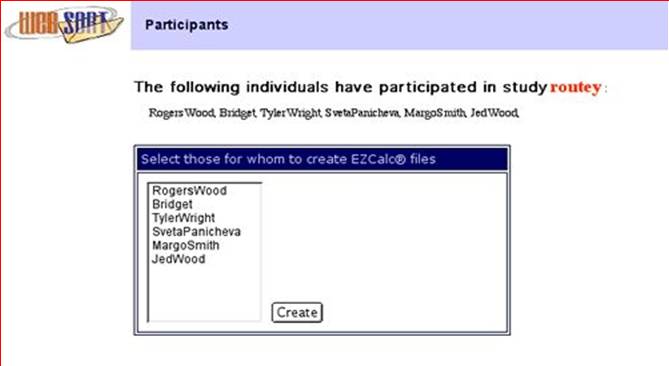
Figure 6. Screen for selecting participants for whom EZCalc© files are to be created.
As indicated earlier, EZCalc© is used to perform a cluster analysis from which an hierarchical structure is created representing the categorical information combined across study participants. An hierarchy generated with EZCalc© for the Student Services example described here is shown in Figure 7.
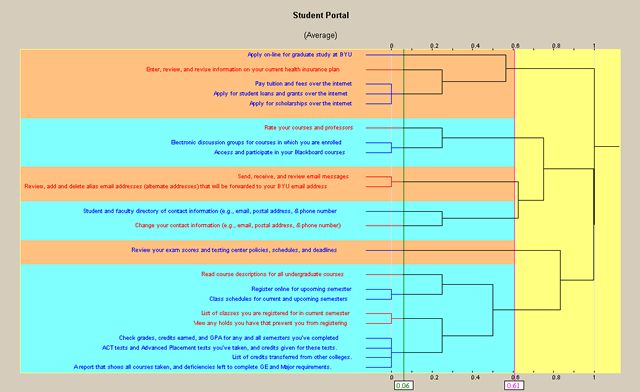
Figure 7. An hierarchy for the Student Services example from EZCalc©.
As shown in Figure 7, the hierarchy provided by EZCalc© provides for considerable flexibility as one follows down the its levels. A designer must still make some final decisions about how many categories make sense, depending on the context of the application under development
Conclusions and Further Work
Our goal is to make it more convenient and more efficient to obtain feedback from users about meaningful labels for features and access to services provided in Web interfaces and to organize them in more meaningful ways for users. Regarding the labeling activity, we have found that careful attention should be given to the instructions given to participants to provide the appropriate context and to avoid unwanted bias. In general, it is probably desirable to provide the labels in a different random order to each participant. However, we have found there are situations when it is more desirable to present them in the same order to all participants. One example of this is when the items to be labeled are an ordered sequence of steps or events. Presenting these to participants in an arbitrary order tends to confuse them.
With regard to categorizing, our current implementation is a bit awkward if participants have put an item in a category represented by a folder at the very “bottom” end and wants to move it up toward the “top” end. We are working to correct this. Because the sorting routine is implemented in Flash version 5, it is not accessible to vision impaired participants who are dependent on screen readers. Flash MX, which has just been release, appears to have potential solutions to this problem.
An interesting problem arises in the context of a redesign project, regarding the choice of participants. It is desirable to have participants who are have not been exposed to the existing information architecture, which may have been designed by IT workers. However, this is often much more difficult to find such participants, and it is still helpful to seek feedback from current users, even though it is difficult for them to avoid letting their familiarity with the existing architecture bias them.
References
Dong, J, Martin, S, & Waldo, P. (1999). A User Input and Analysis Tool for Information Architecture. www-3.ibm.com/ibm/easy/eou_ext.nsf/Publish/410.
Nielsen, J. (1993). Usability Engineering. Academic Press, Boston.
Technical Requirements
As currently implemented, WebSort requires a Web server that supports the PhP programming language and the Mysql, database. The participant categorization interface is currently implemented in FLASH and requires a FLASH plug-in for the Web Browser. The files can be executed on any server with relatively minor changes, once PhP and Mysql database servers have been installed.